Company Financial KPIs Explained: Valona’s Competitive Intelligence Glossary
Most competitive benchmarking quietly assumes the numbers are comparable. They’re not. Companies report in different currencies, on different fiscal calendars, under different accounting standards, and privately held competitors disclose even less. The result is that strategic decisions get made on financial comparisons that haven’t been reconciled. You don’t always know you’re comparing unlike with unlike until the conclusion looks wrong. The KPIs in this glossary are only as useful as the consistency of the data underneath them, which is the problem worth solving before the next planning cycle.
A competitor’s strategy tells you what they want to do. Their financials tell you what they can actually afford to do.
The instinct when benchmarking competitors is to gather more data. But more data without structure is just noise. The value comes from having the right metrics, consistently defined and comparable across your entire competitor set.
A competitor announcing a major expansion or acquisition push is only a credible threat if their balance sheet can support it. Tracking the right financial metrics over time gives you a much more grounded basis for anticipating what they will actually do next.
Why competitor financials need to be normalized before you can benchmark them
Benchmarking competitors on financials sounds straightforward until you try to do it at scale. Companies report in different currencies, use different accounting standards, disclose varying levels of detail, and close their books at different points in the year. A German chemicals company reporting in euros on a December fiscal year, a Japanese rival reporting in yen on a March fiscal year, and a privately held US competitor with limited public disclosure are not directly comparable without significant work.
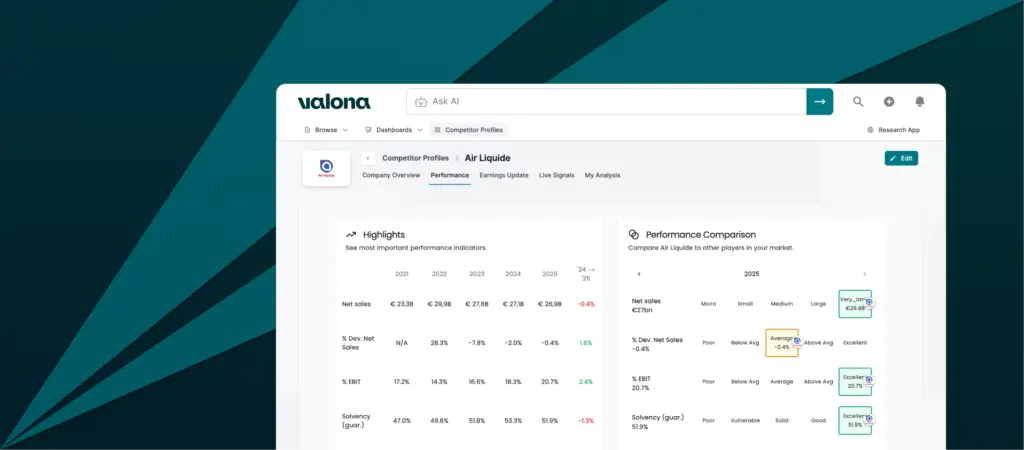
Valona normalizes all of this. Figures are converted to a common currency, mapped into a standardized KPI model, and validated for accounting consistency before being published, covering both public and private companies across geographies. The result is a set of financials you can actually put side by side, without manually reconciling sources or second-guessing whether you are comparing like with like.
How Valona transforms reported figures for comparability
Normalization does not stop at currencies and fiscal years. Some financial line items are reported differently across companies in ways that affect comparability at the metric level. Two adjustments worth knowing about:
COGS vs. COS: Companies use either Cost of Goods Sold (COGS) or Cost of Sales (COS) to report direct costs. COGS covers mainly raw material and production input costs. COS is broader and can include staff costs, depreciation, and other production-related overheads, meaning COS reporters typically show slimmer gross margins not because they are less efficient but because more costs sit in that line. Where possible, Valona adjusts COS figures to an implied COGS to allow like-for-like comparison, though this depends on the level of detail disclosed in each company’s annual report.
EBIT and EBITDA: Exceptional items, such as one-off restructuring charges or asset write-downs, can significantly distort a company’s reported operating result. Because these are not part of normal operations, Valona strips them out when they are reported separately in the profit and loss statement, updating EBIT and EBITDA to reflect underlying operational performance rather than a figure inflated or deflated by non-recurring events.
Company Structure & Balance Sheet
These are balance sheet metrics: snapshots of a company’s financial position at a single point in time rather than measures of flow or performance over a period. Changes year on year are often more telling than the absolute figures themselves.
| KPI | Definition and why it matters competitively |
|---|---|
| TANGIBLE FIXED ASSETS | Physical long-term assets used in operations: buildings, machinery, vehicles, equipment. Tracking a competitor’s tangible asset base over time can signal strategic shifts. A rapid build-up may indicate capacity expansion or market entry investment, while a declining base may point to restructuring, outsourcing, or a move toward asset-light operations. |
| INTANGIBLE FIXED ASSETS | Non-physical assets with lasting value: patents, trademarks, software, customer relationships, and goodwill from acquisitions. A rising intangible asset base is often a signal worth investigating. It can indicate active M&A, increased R&D capitalization, or a deliberate shift toward IP-driven business models, all of which have strategic implications for how a competitor competes. |
| EQUITY | The remaining value of a company’s assets after all liabilities are deducted, combining paid-in capital, retained earnings, and reserves. Equity trends reveal whether a rival is accumulating financial strength or eroding it, and how much cushion it has to absorb downturns, fund acquisitions, or sustain investment through a difficult cycle. |
| NET DEBT | Total financial debt minus cash and cash equivalents. A competitor with low or negative net debt has significant strategic flexibility: it can invest, acquire, or weather a downturn without immediate pressure. A competitor carrying high net debt is more constrained and may be forced to prioritize debt reduction over growth. Monitoring net debt shifts helps you anticipate whether rivals are gearing up for expansion or tightening their belts. Net debt: Total non-current liabilities + (Total current liabilities – Trade creditors) – Cash and cash equivalents |
| SOLVENCY | Long-term financial stability, calculated by dividing equity by total assets. A ratio above 20% is generally considered healthy. In competitive intelligence, solvency is most useful as a risk indicator: a rival with deteriorating solvency may face pressure to divest assets, cut investment, or restructure, which can signal competitive vulnerability or create opportunity. Solvency: Shareholders’ equity / Total assets |
| QUICK RATIO | Short-term liquidity, calculated by dividing current assets excluding inventories by current liabilities. A ratio above 100% is typically considered healthy. Competitors with weak quick ratios may be vulnerable to short-term cash pressure, constraining their ability to invest or respond to market moves. A persistently high quick ratio can indicate underdeployed capital. Quick ratio: (Total current assets – Inventories) / Total current liabilities |
Investment
Capex figures are available for both listed and private companies in Valona, though private company disclosure varies by geography and registry. They are also one of the earlier indicators of strategic intent: investment in new capacity or infrastructure typically precedes any impact on revenue or profitability by several years.
| KPI | Definition and why it matters competitively |
|---|---|
| NET CAPEX | The net amount spent on a company’s fixed assets: capital expenditures minus proceeds from selling assets minus total depreciation. Positive net capex indicates a company is investing in and growing its asset base. Negative net capex suggests it is selling more assets than it is acquiring, or that depreciation is outpacing new investment. One of the clearest signals of strategic intent: a competitor ramping up net capex is building capacity or expanding, while one with declining net capex may be harvesting an existing position or preparing to exit. Also expressed as a percentage of net sales (% Net Capex). Net Capex: (∆ Tangible assets + ∆ Intangible assets) + Total depreciations |
| NET CAPEX / TOTAL DEPRECIATIONS | Divides net capex by total depreciation, showing whether a competitor is expanding its asset base or letting it shrink. A ratio above 1 indicates expansion; below 1 indicates a decline in fixed assets. Tracking this across a competitor set reveals which players are betting on future capacity and which are running their assets into the ground, a meaningful divergence in capital-intensive industries. |
Cashflow & Liquidity
Profit and cash are not the same thing. A company can report strong earnings while generating little actual cash, due to working capital dynamics, accounting choices, or heavy investment. Cashflow metrics cut through this and show what a competitor actually has to work with.
KPI | Definition and why it matters competitively |
|---|---|
| NET OPERATIONAL CASHFLOW | Cash generated from core business operations, after adjusting for working capital movements and subtracting financial expenses and taxes. Also expressed as a percentage of net sales (% Net Operational Cashflow). Often a more reliable indicator of underlying business health than profit figures, since it reflects actual cash generation. A competitor generating strong operational cashflow has real funding firepower for investment, M&A, or shareholder returns. Net operational cashflow: EBIT + Total depreciations + Changes in net working capital – Financial expenses – Taxes |
Profitability & Performance
The most widely tracked section in competitive benchmarking. These metrics are reported in some form by virtually all companies and form the backbone of year-on-year performance comparison. Margin metrics expressed as a percentage of net sales are particularly useful for comparing companies of different sizes.
| KPI | Definition and why it matters competitively |
|---|---|
| COST OF GOODS SOLD (COGS) / COST OF SALES (COS) | The direct costs of producing what a company sells. As a percentage of net sales, it shows how much of each revenue unit is consumed before reaching gross profit. Competitors with structurally lower COGS ratios have more room to absorb cost inflation, invest in growth, or compete on price. Shifts in this ratio over time can reveal cost pressures a rival may not be explicitly communicating. |
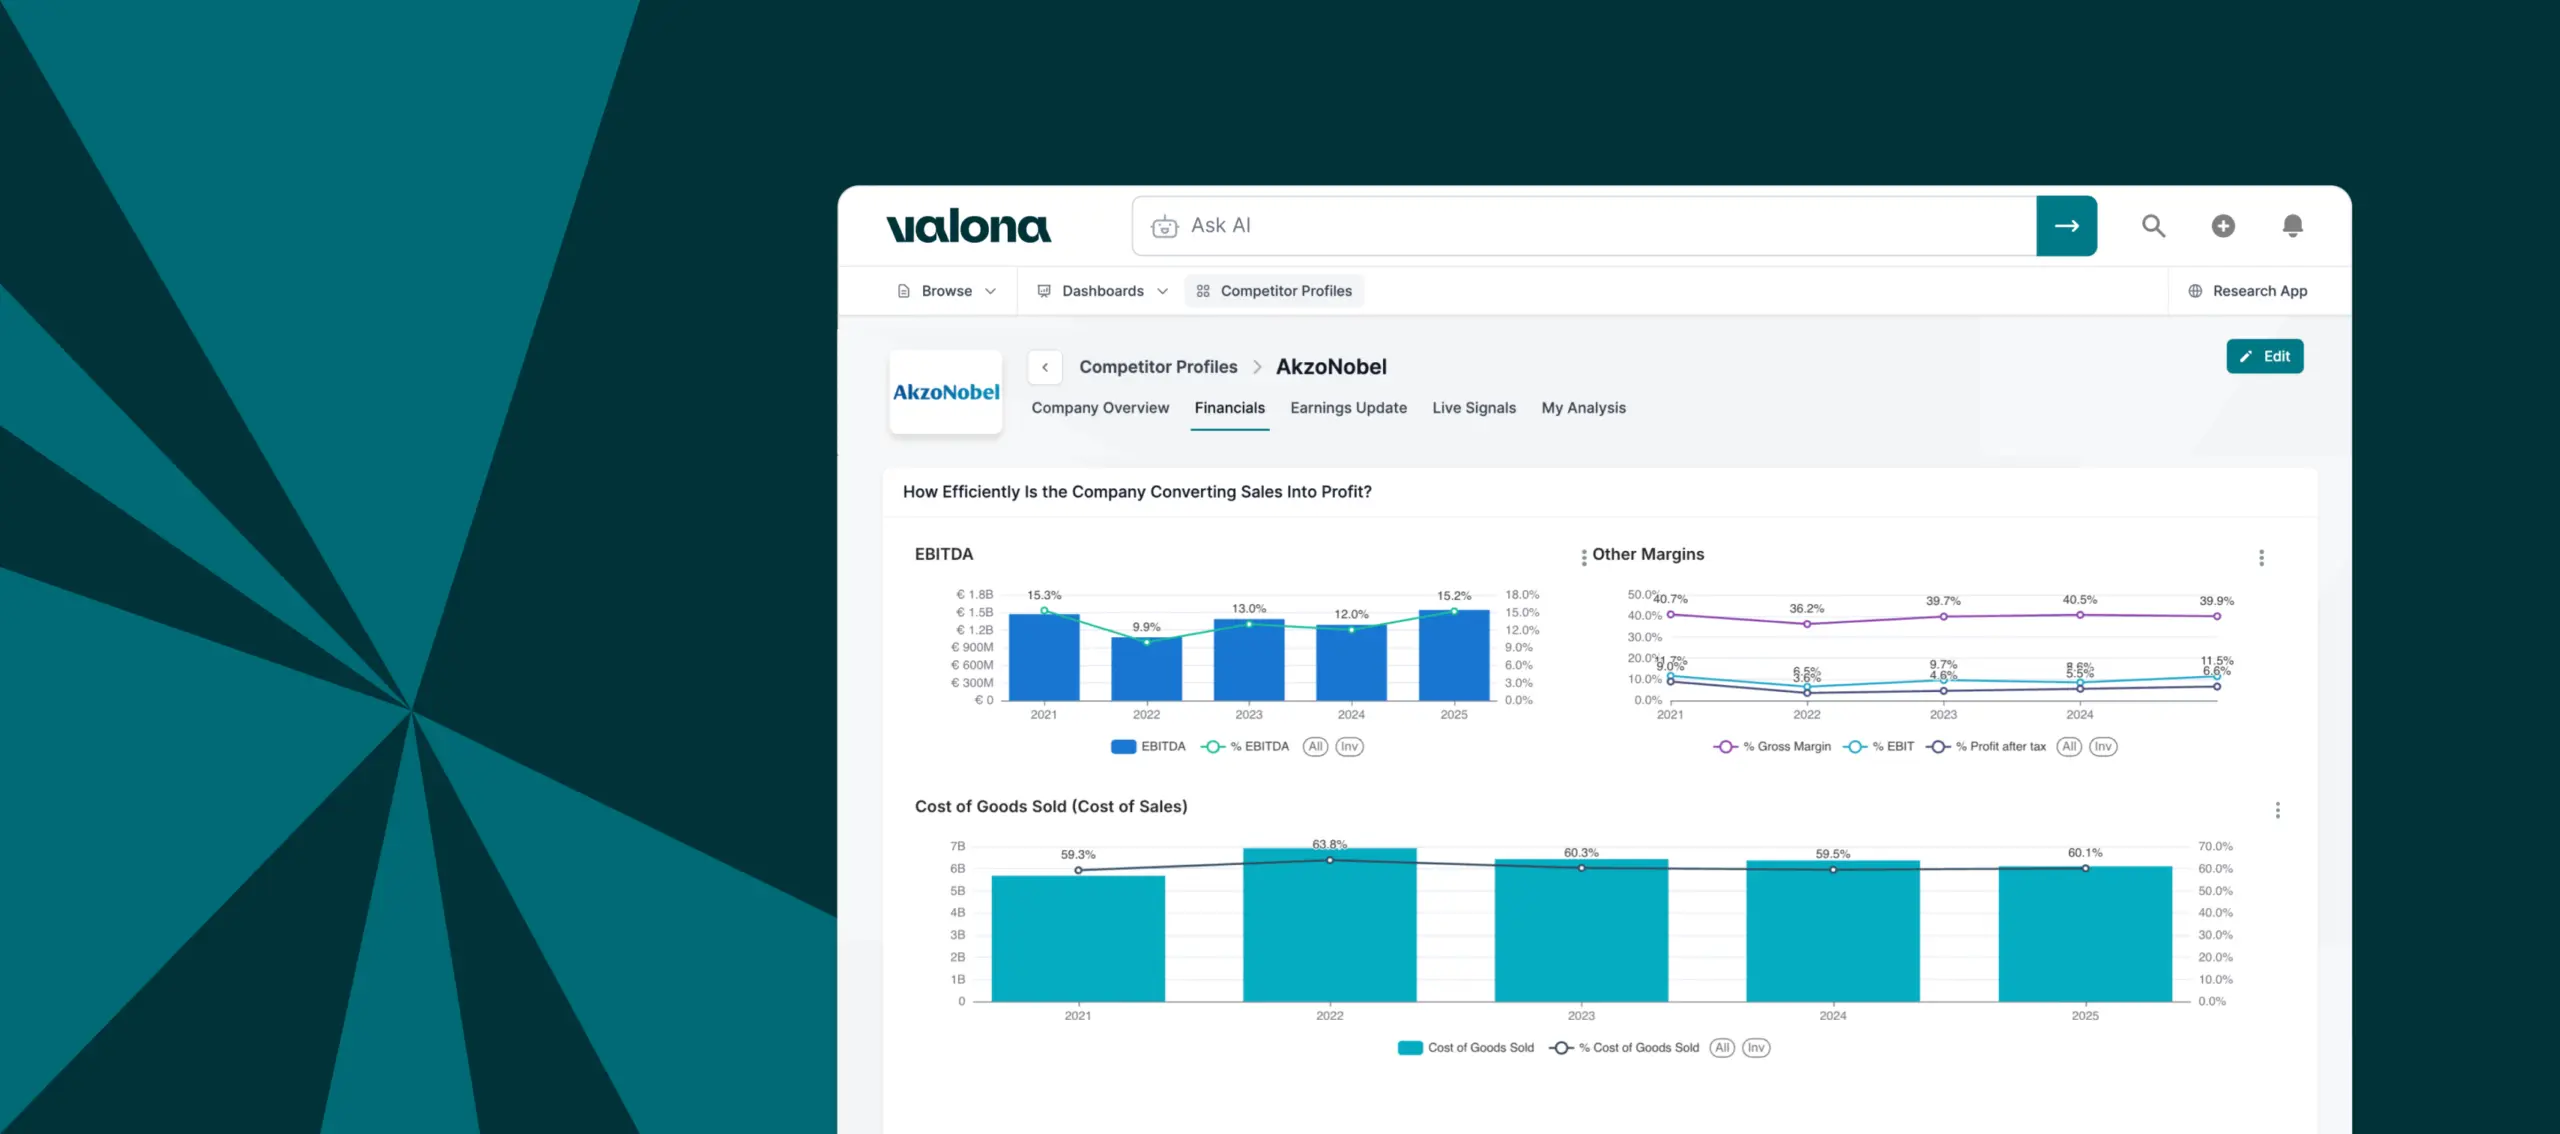
| GROSS MARGIN | Net sales minus COGS or COS, also expressed as a percentage (% Gross margin). The most direct test of competitive positioning: comparing gross margins across rivals reveals structural differences in pricing power, product mix, or manufacturing efficiency. A widening gap is an early warning sign worth understanding. |
| EBITDA | Earnings Before Interest, Taxes, Depreciation, and Amortization. Measures operating cash generation from core activities before non-cash charges and financing effects, also expressed as a margin (% EBITDA). The most widely used metric for cross-company benchmarking across geographies and ownership types. Also anchors leverage analysis: a competitor with high net debt relative to EBITDA has limited room to maneuver. |
| EBIT | Earnings Before Interest and Taxes. Operating profitability after depreciation but before interest and tax, also expressed as a margin (% EBIT). Unlike EBITDA, it reflects the cost of maintaining a company’s asset base, making it more informative in capital-intensive sectors where asset intensity varies significantly across rivals. |
| PROFIT BEFORE TAXES | Earnings Before Interest and Taxes. Operating profitability after depreciation but before interest and tax, also expressed as a margin (% EBIT). Unlike EBITDA, it reflects the cost of maintaining a company’s asset base, making it more informative in capital-intensive sectors where asset intensity varies significantly across rivals. |
| PROFIT AFTER TAXES | Earnings after all expenses including taxes, also expressed as a margin (% Profit after taxes). Represents what is available to shareholders. Most useful when tracked over time or compared to peers in the same tax environment, as tax accounting choices can distort year-on-year comparisons. |
| RETURN ON ASSETS (ROA) | Profit after taxes divided by average total assets. A competitor with similar revenues but meaningfully higher ROA is getting more out of less, often reflecting deeper advantages in process efficiency or business model design. A diverging ROA trend is a strategic signal worth investigating. Return on Assets (ROA): Profit after taxes / (x̄ Total assets) |
Scale & Workforce
Headcount data is widely available but often overlooked in competitive benchmarking. FTE trends over time can be an early indicator of where a competitor is investing or pulling back, before it shows up in financial results.
KPI | Definition and why it matters competitively |
|---|---|
| TOTAL STAFF (FTE) | Total headcount expressed in full-time equivalents, normalizing part-time roles for accurate cross-company comparison. Headcount trends reveal strategic direction: a rival expanding aggressively is likely investing in growth capacity, while one quietly shrinking may be restructuring or retreating. Combined with revenue, FTE enables net sales per FTE calculations, a useful proxy for workforce productivity. |
Working Capital
Working capital metrics are derived figures, calculated from balance sheet and income statement data rather than reported directly by companies. Availability in Valona varies by industry.
| KPI | Definition and why it matters competitively |
|---|---|
| WORKING CAPITAL | The difference between a company’s current assets and current liabilities, representing the funds available for day-to-day operations. Positive working capital is generally healthy, though persistently high levels can indicate excess inventory or underdeployed cash. Negative working capital is not necessarily a bad thing, though it can become problematic if sustained over time. Working capital norms vary significantly by industry, so comparison within a sector is more meaningful than absolute benchmarks. Reveals how efficiently a rival manages the gap between paying suppliers and collecting from customers. |
| CASH CONVERSION CYCLE (CCC) | How long it takes a company to convert investments in inventory into cash from sales, made up of three components: DIO, DSO, and DPO. A shorter CCC means faster cash recycling. Comparing CCC across competitors reveals structural differences in supply chain efficiency, customer payment terms, and inventory management. CCC: DSO + DIO – DPO |
| DAYS SALES OUTSTANDING (DSO) | The average number of days a company holds inventory before selling it. A rising DIO at a competitor can indicate slowing demand, supply chain buildup, or operational inefficiency, and is often an early warning sign worth monitoring. DSO: (x̄ Trade receivables) / Net sales * Days in fiscal year |
| DAYS INVENTORY OUTSTANDING (DIO) | The average number of days a company holds inventory before selling it. A rising DIO at a competitor can indicate slowing demand, supply chain buildup, or operational inefficiency, and is often an early warning sign worth monitoring. DIO: (x̄ Inventories) / COGS * Days in fiscal year |
| DAYS PAYABLES OUTSTANDING (DPO) | How long a company takes to pay its suppliers. A high DPO improves short-term cash flow by holding onto cash longer, though very high DPO can strain supplier relationships. Reveals differences in supplier leverage and cash management strategy. A rival with significantly higher DPO may have stronger negotiating power, or may simply be stretching payables as a liquidity measure. DPO: (x̄ Trade creditors) / COGS * Days in fiscal year |
From financial data to competitive insight
Knowing a competitor’s EBITDA margin or net debt position is a starting point. Understanding what it means for their next move requires connecting it to what they are actually doing and saying in the market. Valona combines financial data with continuous qualitative monitoring, AI-generated analysis, and for listed companies, earnings analysis delivered within hours of each reporting event, so the numbers and the narrative stay connected.
This glossary covers a selection of the financial KPIs available through Valona’s platform. All figures are standardized to ensure like-for-like benchmarking across public and private companies. For questions about coverage or methodology, contact your Valona account team.